Some C syntax

Posted in Uncategorized on November 21, 2019 by yaoqi

After using C language for 10+ years, I find there are still some syntax I am not clear of.

char *q = { 0 }; // 1

At first, I doubt it is a valid c syntax, but turns out it is. Then, I find this sentence in C99 6.7.8p11,

The initializer for a scalar should be a single expression, optionally enclosed in braces.

So the code above is equivalent to this,

char *q = 0;

Then, let us look at a slightly different example,

char *p = (char *) { 0 }; // 2

It looks quite similar to the example 1, but they are different. The expression on the right hand side of assignment is called compound literal, which is composed by parenthesized type name and a list of initializer, specified in C99 6.5.2.5. In this case, the type is char * (not an array type), so the list of initializer’s type is char *.

Two examples have the same effect, which is to set pointer to NULL.

Create your own passport/visa photo using imagemagick

Posted in misc with tags on March 5, 2018 by yaoqi


This article is actually inspired by Create your own Passport Photo using GIMP. I did use it to get photo for my family for my Schengen visa. It is quite useful, but it is still error-prone during the steps, because GIMP is GUI interactive program. I wonder I can use imagemagick to do the same.

Here is the photo taken by my camera in my home 19.jpg The first step is select part of the photo having my face with the right ratio,

top_left_x=1800
top_left_y=680
crop_scale=5
# Select part of the photo with fixed ratio 350x450.
convert $photo_name -crop $((350*crop_scale))x$((450*crop_scale))+$top_left_x+$top_left_y 11.jpg

I need to run this command multiple times, to adjust these three variables to get right photo

11.jpg

The rest steps are quite mechanical.

# Scale the image.  It is expected to get 750x964.
convert 11.jpg -resize 750 12.jpg

12.jpg

# Expand the boarder.
convert 12.jpg -background white -gravity center -extent 814x1092 13.jpg

13.jpg

# Duplicate it vertically.
convert 13.jpg -duplicate 1 -append  14.jpg

14.jpg

montage 14.jpg 14.jpg 14.jpg 14.jpg -tile 4x1 -geometry +0+0 15.jpg
# It is expected to get 3256x2184
identify -format "%[fx:w]x%[fx:h]" 15.jpg

15.jpg I put different people’s photo (4 people in maximum) here so I can print one photo somewhere, and get all the 4 people’s passport/visa photo.

Parse buildbot data

Posted in python with tags , on February 28, 2018 by yaoqi


GDB project has a public buildbot where we build GDB on different hosts for each commit. Recently, there was a patch broke non-x86 GDBserver so that the testing with GDBserver takes much more time (from several minutes to several hours) on buildbot.

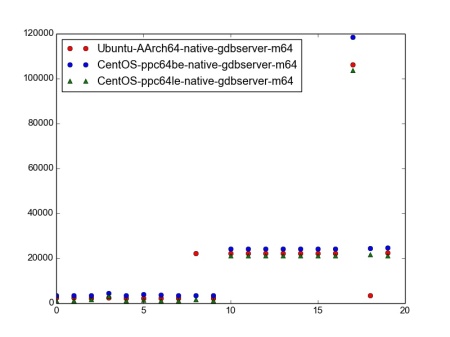
I wonder that I can write some script to take the time of testing in each build and plot them. Buildbot is able to export the data in json format, so that it is very easy to parse and analyze. Here is a python script, which gets the time of testing gdb in 20 builds.

import urllib, json
import matplotlib.pyplot as plt
# build 4141
aarch64_times = []
for x in range(0, 20):
    filehandle = urllib.urlopen('https://gdb-build.sergiodj.net/json/builders/Ubuntu-AArch64-native-gdbserver-m64/builds/' + str(4141 - 10 + x))
    builder = json.loads(filehandle.read())
    elapsed_time = builder['times'][1] - builder['times'][0]
    aarch64_times.insert(x, elapsed_time)

ppc64be_times = []
for x in range(0, 20):
    filehandle = urllib.urlopen('https://gdb-build.sergiodj.net/json/builders/CentOS-ppc64be-native-gdbserver-m64/builds/' + str(155 - 10 + x))
    builder = json.loads(filehandle.read())
    elapsed_time = builder['times'][1] - builder['times'][0]
    ppc64be_times.insert(x, elapsed_time)

centos_ppc64le_times = []
for x in range(0, 20):
    filehandle = urllib.urlopen('https://gdb-build.sergiodj.net/json/builders/CentOS-ppc64le-native-gdbserver-m64/builds/' + str(154 - 10 + x))
    builder = json.loads(filehandle.read())
    elapsed_time = builder['times'][1] - builder['times'][0]
    centos_ppc64le_times.insert(x, elapsed_time)

# print times
plt.plot(aarch64_times, 'ro',label='Ubuntu-AArch64-native-gdbserver-m64')
plt.plot(ppc64be_times, 'bo',label='CentOS-ppc64be-native-gdbserver-m64')
plt.plot(centos_ppc64le_times, 'g^', label='CentOS-ppc64le-native-gdbserver-m64')

plt.legend(loc=2)
#plt.show()
plt.savefig('buildbot.jpg')

buildbot

in this chart, x axis is each buildbot build, and y axis is the test time in seconds. The bad patch is build on 10, which increase the test time a lot. There is also another interesting build which is slowed down on all builders as well.

override C++ operator new/delete

Posted in C++ with tags on January 29, 2018 by yaoqi

Today, I tried override operator new/delete in C++ in my class so that the objects of this class are allocated from a specific memory pool instead of from heap.  There are a lot of things on internet already on this topic, but I want to write something down which are interesting to me during my study.

First of all, I find slightly two different code,

class not_on_heap
{
public:
  void* operator new (size_t size, struct obstack *obstack)
  {
    return obstack_alloc (obstack, size);
  }
  void operator delete (void* memory) {}
}
class not_on_heap
{
public:
 static void* operator new (size_t size, struct obstack *obstack)
 {
   return obstack_alloc (obstack, size);
 }
 static void operator delete (void* memory) {}
}

The former doesn’t have static, while the latter has.  Are they different or the same?  After some googling, I find they are the same as mentioned in C++ specification, “Any allocation function for a class T is a static member (even if not explicitly declared static).”

Then, I want to use this class in main, as a test, to make sure the objects can be allocated in obstack.  At this point, I assume that objects can be still allocated on heap because I don’t delete “void* operator new (size_t size)”,

  not_on_heap ob1;

  obstack ob;
  not_on_heap *ob2 = new (&ob) not_on_heap ();
  not_on_heap *ob3 = new not_on_heap ();

that is, I expect “ob2” is allocated in obstack and “ob3” is allocated on heap.  However, compile emit the error like this,

1.cc: In function ‘int main()’:
1.cc:34:39: error: no matching function for call to ‘not_on_heap::operator new(sizetype)’
 not_on_heap *ob3 = new not_on_heap ();
                                     ^
1.cc:16:16: note: candidate: ‘static void* not_on_heap::operator new(size_t, obstack*)’
 static void* operator new (size_t size, struct obstack *obstack)
              ^~~~~~~~

why doesn’t compile look for the global “new” as I don’t define it in my class?  Again, after some googling, I find the answer in C++ specification, “if the allocated type is a class type T or array thereof, the allocation function’s name is looked up in the scope of T.”  The compiler finds “new (size_t size, struct obstack *obstack)”, although it doesn’t match, it still stops looking for “new (size_t size)” in global scope.

GDB test on ARM Chromebook

Posted in GDB with tags , on September 5, 2016 by yaoqi

I’ve got an ARM Chromebook for a year, but I didn’t fully make use of it for GDB testing, because

  • It is not easy to install linux on Chromebook
  • It is not easy to use mainline kernel on Chromebook,

Recently, I tried again to upgrade its kernel, and tweak the kernel a little bit for GDB testing.  I write my experiences down in this post.

Install a Linux distribution

Ubuntu is better than Fedora on usability, but Fedora is much better on debugging support (in kernel, system library, and compiler).  I choose Fedora 19 for my Chromebook.  Here is the article.  Follow the instructions in the article, a Fedora 19 is installed on an SD card, with five partitions, the first two are for kernels, and last one is for root file system.

Upgrade to mainline kernel

The fundamentals of GDB debugging are ptrace and signals, so it highly relies on kernel.  From time to time, we (GDB developers) have to upgrade kernels to

  • verify kernel bug fixes, so these kernel bugs will not affect GDB in user space,
  • make sure kernel changes don’t make any troubles to debugging,

I use 4.7.2 kernel.  Configure and build it.

make CROSS_COMPILE=arm-linux-gnueabihf- ARCH=arm exynos_defconfig
make CROSS_COMPILE=arm-linux-gnueabihf- ARCH=arm prepare modules_prepare
make CROSS_COMPILE=arm-linux-gnueabihf- ARCH=arm zImage modules dtbs
make CROSS_COMPILE=arm-linux-gnueabihf- ARCH=arm INSTALL_MOD_PATH=../4_7_2 modules_install

I also need arch/arm/boot/zImage and arch/arm/boot/dts/exynos5250-snow.dtb to build kernel image,

mkimage -f kernel.its kernel.itb
vbutil_kernel --pack newkernel \
 --keyblock /usr/share/vboot/devkeys/kernel.keyblock \
 --version 1 \
 --signprivate /usr/share/vboot/devkeys/kernel_data_key.vbprivk \
 --config kcmdline --vmlinuz kernel.itb --arch arm

File kernel.its describes the kernel image.  Write the generated newkernel to partition 1 of SD card on PC.

sudo dd if=./newkernel of=/dev/mmcblk0p1

Then, we need to update root file systems to have kernel modes.  Mount partition 5 somewhere, and copy 4.7.2 kernel modules to lib/modules/

$ sudo mount /dev/mmcblk0p5 ./tmp/
$ sudo cp ../4_7_2/lib/modules/4.7.2 ./tmp/lib/modules/

Insert the SD card back to Chromebook, and boot!

Turn on HW breakpoint

HW brekapoint in kernel is not turned on in default, and it depends on perf events.  I need to reconfigure kernel to enable them.

make CROSS_COMPILE=arm-linux-gnueabihf- ARCH=arm menuconfig

In “General Setup”, select “Kernel Performance Events And Counters”, and then select perf events.  Exit.  Open .config file, and search HW_BREAKPOINT, to make sure HW breakpoint is enabled.  Rebuild kernel to follow the steps above.  Reboot and “breakpoint” is shown the boot message,

$ dmesg | grep breakpoint
[ 0.102099] hw-breakpoint: found 5 (+1 reserved) breakpoint and 4 watchpoint registers.
[ 0.102119] hw-breakpoint: maximum watchpoint size is 8 bytes.

Exception handling

Posted in GDB with tags on April 25, 2016 by yaoqi

We recently converted GDB source code C++ compatible, so that GDB can be built as a C++ program by C++ compiler in default.  In the first day of switch, we find that GDB exception handling stopped working, see here.

After some investigations by Pedro,  we find that the cause of this problem is that EH frame unwinder can not run across “foreign frames“, which is C frames compiled without -fexception.  In short,  in order to support exception, compiler emits some “debug info” to help runtime unwinder to unwind frames one by one to locate the right “catch” for a throw.  For example, function a calls b, b calls c, function c throws exception, which is caught in a.  When the exception is thrown, the runtime unwinder checks there is no catch in the frame of function c, then it unwinds to the frame of function b, then to the frame of function a, finds there is a right catch for the exception, transfer the control to that.

This requires such “debug info” should exist in every frame in the call-chain.  If there is one frame which doesn’t have such “debug info”, runtime unwinder can’t unwind further and call the default handler, which aborts the whole program.  That is exactly what happened in GDB, GDB is a C++ program, but is still using readline library to handle command input and history, which is written in C.  GDB function is passed to readline library as a callback.  If exception is thrown, runtime unwinder can’t unwind across readline frames, and has to abort.  Then, the root cause of this problem is quite clear, and the fix is straightforward.  Thanks to Pedro!

In the meantime, I searched online and find some useful links on exception handling.  The first one is EH newbies howto posted in gcc mail list in 2002.  The second one is more about handling exception from the debugger’s point of view.

Run DejaGNU tests on two (or more) boards

Posted in Uncategorized on March 25, 2015 by yaoqi

Today, I want to run a certain GDB test case on different boards with different compilation options, and usually I run the test case each time for one board.  It works well for me, but I need to take care of gdb.sum after each run to avoid it being overwritten in the following run.

There must be some other better approaches to do so.  Fortunately, there are two.  One is about using global config file, and the other one is to pass multiple target boards to DejaGNU.  I feel the latter is more convenient.  I just simply type the following commands in shell to run break.exp test on board foo with -mfloat-abi=hard and on board bar with -mfloat-abi=soft -marm -march=armv4t.

$ make check RUNTESTFLAGS="--target_board='foo\{-mfloat-abi=hard\} bar\{-mfloat-abi=soft\}\{-marm\}\{-march=armv4t\}' break.exp"
Schedule of variations:

foo/-mfloat-abi=hard
bar/-mfloat-abi=soft/-marm/-march=armv4t

PTE 考试

Posted in Uncategorized on February 24, 2015 by yaoqi

由于签证的要求,我需要尽快有一个认可的英语成绩。雅思或者PTE都可以,尽管要求很低,但是我也不想在这里有什么闪失。经历了半个月,从一无所知,开始复习,考试,最终得到合格的成绩,还是有很多有意思的事情的。

第一个问题,就是选择哪种考试。我们都很熟悉雅思,考生众多,复习资料全面,但是考试出结果有些慢。PTE是一个很陌生的考试,没有对应的复习资料,考生也少,没有什么讨论,但是出成绩很快,考试第二天,就能得到成绩。在网上问的最多的一个问题,就是PTE和雅思哪个难。我觉得这个问题没有什么意义,这两个考试都被一些学校认可,而且有一个大致的分数换算关系,所以,两个考试没有什么难易之分。所以,我就选择了PTE,因为我可以尽快得到成绩。在花了几天研究PTE考试之后,我在11月4日报名,预约在11月13日考试。

第二个问题,就是如何安排复习,我前后大概有两周的时间,但是我现在还在上班,没有办法全职去复习这个考试。我在两周里,每周请假三天,进行复习,再加上周末,感觉复习的时间还是够用的。

先说说我的英语背景吧。我在2001年,考过四六级以后,还在一直学习英语,但是再没有为了考试复习过。2006年,工作以后,虽然是在外企工作,每天邮件都是英语,但是感觉听力,词汇量和口语在慢慢退化。虽然每周和老外开会,但是词汇面太窄,就那么几个词,来回用。2010年以后,一年去美国出差两次,感觉口语一般,听力很差,但是阅读和写作应该没有问题。

考虑到不管我选择哪种考试,词汇都是需要的,在没有选择之前,我就开始背单词了。我用的是新东方出的雅思词汇,词汇比六级词汇多一些,主要有一些很专业的词汇,比如人类学家,之类的。我认识的单词挺多,但是那些不认识的单词真不好记。可能是花的时间不够,总记不住那些单词。我虽然认识的单词多,但是拼写竟然成了大问题。这些年,写邮件,文档,都带着拼写检查和自动补全,很不注意拼写,有了错误,就能看到。考试的时候,没有拼写检查,就没有底了。所以,建议大家,平时写英文,不要依赖拼写检查。从我考试的感觉,两周时间,对单词的提高不是很多。

下来就是要准备听力了,PTE考试里边的听力大多和学校学习和研究有关系,比如听一段教授在课堂里边讲课,内容涉及各个方面,比如心理研究,儿童教育,历史,农业,等等。我就在PTE的网站上找了一些可以下载的样题,听了听,做了做。然后买了一本PTE 考试的 Official Guide,里边带了一些题目。对我而言,听懂那些文章或者对话,十分困难,大概只有一半的内容能听懂,有的压根不知道在说什么,所以那个时候,很郁闷,就怕考试考不过。不过,没有办法,只能硬着头皮去听了。于是,就把样题,一遍一遍的听,直到全部听懂为止。从我考试的感觉,听力有一些提高,但是不多。

下来就是要准备作文了。PTE 考试里边有一到两个写作。虽说我每天写很多英语邮件,但是这些和英语写作还是不一样。我买的《十天突破雅思写作》,把里边的例句背了背,对作文结构和思路熟悉了一些。而且,雅思的小作文,看图写作部分和PTE里边的看图说话部分类似,这本书里边有一些很好的词汇,描述一个line graph,bar char之类的,所以这个对PTE describe image 部分也有用。总体说来,两周的准备,作文部分进步还是挺大的。

最后,在考试前一天,我做了一次模拟考试,PTE网站提供模拟考试,$35一次,帮助挺大。会发现有些部分时间不够,不能思考过多。总成绩60,Listening, Reading, Speaking, Writing 分别是 66 55 53 60。有些分数可以帮助你总结考试的方式。比如,考试第一部分是给小段话,在40秒内熟悉,然后读出来。我的speaking分数好低,我本来对我的speaking还是很有信心的。我总结可能是读的太快,没有停顿造成的。后来,在考试中改进了一些,成绩就有所提高了。所以,这个钱花的挺值的。

最后说说考试吧,我是11月13日在亮马桥附近考试的。考试下午两点开始,我不到一点就到了。考试地点在kaplan international college的办公室里。我到了那里我就看到,PTE 考试房间的门,外边有12个柜子用来放考生的物品的(PTE考试不允许考生带任何东西进入考场)。只有12个柜子,说明考生不会很多,不会出现,考生需要大声说话,才能避免相互干扰。到了一点半,一个外国哥哥出来,给前台说,今天只有一个学生考试。我就站起来,说,我是来考试的。然后,就开始帮我准备考试,比如用我的记录我的护照,拍照,扫描掌纹等等。快到两点的时候,我进入了考试房间,其实就是一个小房间,里边放了8台电脑,每个座位都有摄像头,他们在外部看着。考试开始后,我也没有想像的那么紧张。不过里边遇到了一些之前没有碰到的类型的题目,不过还好,不算难。听力部分还是听的不好,但是speaking部分,觉得说的还不错。中间休息了一次,还要刷掌纹。最后4点半考完的,感觉一般,没有那么好,但是觉得轻松了好多,终于可以专心上班了。

第二天,过了中午就开始去PTE网站刷我的成绩了,系统总说成绩还没有好,让我等邮件。快两点的时候,突然收到邮件,说我的成绩出来了,但是邮件里边没有说分数。于是我非常紧张的打开网页,网站还特别慢,那个感觉真是不好形容。我觉得我当年高考查分都没有这样。打开了pdf文件,看到分数是 60 64 58 65。我就长出一口气,但是没有看到总分,找了半天,看到我的总分是61。感觉还是很高兴的!

PTE是一个很新的考试,没有过多的资料和介绍,有些神秘。不过考试内容还是很贴近实际应用,对实际的英语能力有很客观的评估,因为我们那些传统的考试技巧没有什么用处。

eh_frame or debug_frame

Posted in Uncategorized with tags on October 14, 2014 by yaoqi

Jason Molenda explains eh_frame and debug_frame in a discussion in lldb mail list.

Powerful testing with DejaGNU

Posted in GDB with tags on September 1, 2014 by yaoqi

Although I complain about DejaGNU from time to time, it still deserves this post about running tests with multiple variations, which allows you to run your tests with a combination of different options.

make check RUNTESTFLAGS='--target_board=qemu-system-arm\{-marm,-mthumb\}\{-march=armv7-a,-march=armv4t\} call-ar-st.exp'

The test case is compiled and executed four times with different compilation flags, {-marm, -mthumb} x {-march=armv7-a,-march=armv4t}, and you can see the following from console:

 === gdb tests ===

Schedule of variations:
 qemu-system-arm/-marm/-march=armv7-a
 qemu-system-arm/-marm/-march=armv4t
 qemu-system-arm/-mthumb/-march=armv7-a
 qemu-system-arm/-mthumb/-march=armv4t

The test summary is appended to gdb.sum and aggregated like this:

 === gdb Summary for qemu-system-arm/-mthumb/-march=armv4t ===

# of expected passes 45
# of unexpected failures 1

 === gdb Summary ===

# of expected passes 180
# of unexpected failures 4

Note that the test is compiled and run four times in a serialized manner. GDB extends it to allow each variations running in parallel.

make -j2 -k check//qemu-system-arm/{-marm,-mthumb} TESTS='gdb.base/call-ar-st.exp'

GDB test harness starts two instances of running in parallel, for -marm and -mthumb, in directories testsuite.qemu-system-arm.-marm and testsuite.qemu-system-arm.-mthumb respectively. The compiled executables are not overwritten because they are located in different directories.

Last but not least, you need this line in the board file (qemu-system-arm.exp in my case):

process_multilib_options ""